
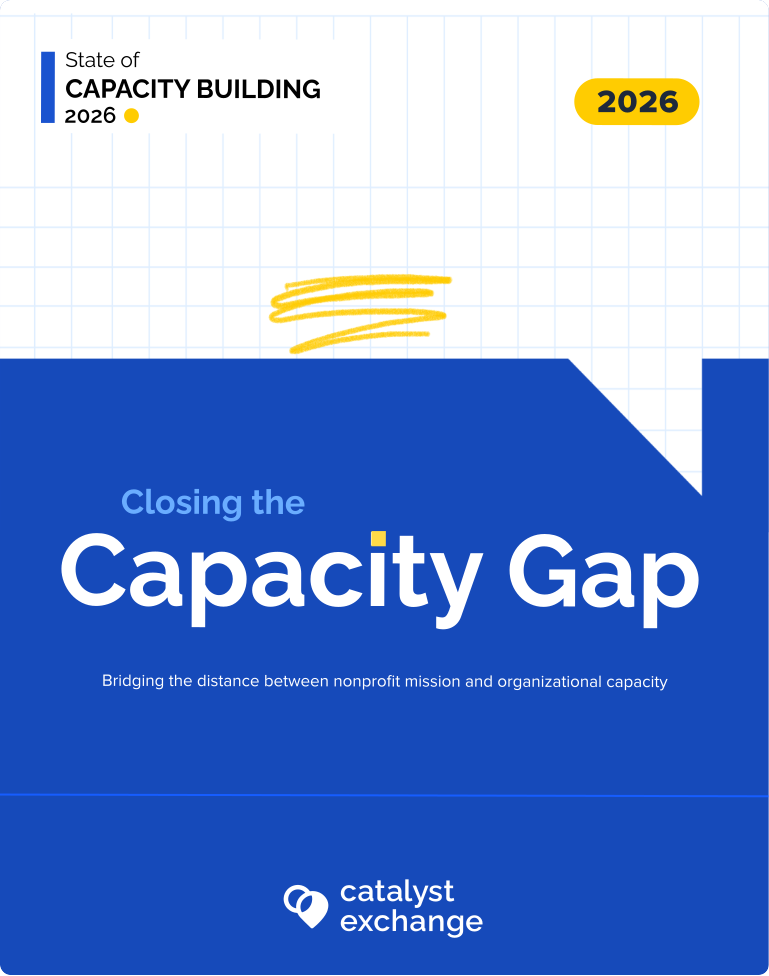
Read 'Closing the Capacity Gap', the inaugural report from our State of Capacity Building study!
SVG-1
Frame 1000004244

Closing the Capacity Gap

What nonprofits need, what gets funded, and what works are too often disconnected. This inaugural report from our ongoing State of Capacity Building study maps the gaps and explores what it would take to bridge them.

SOCB logo
Ellipse 883-1
Ellipse 884
Operations, Finance, and Legal-1
Teaching and Learning-1
Networked Improvement-1
Technology and Data (1)-1
Ellipse 886
Ellipse 887 (1)

The State of Capacity Building study aims to create a shared evidence base to help nonprofits, funders, intermediaries, and others make better decisions about how organizational capacity is recognized, resourced, and strengthened. 

This inaugural edition focuses on organizations working in education and youth development and draws on a national survey of 408 nonprofits, 135 funders, and 101 intermediaries. The report is organized around four questions: What capacity needs are nonprofits experiencing? How are those needs being resourced, and to what extent? What shapes whether capacity-building support produces meaningful results? And how does that path differ depending on where an organization starts?

Group 41181 (1)

Selected findings

The highlights below offer a snapshot of the data. Download the full report for the complete findings, analysis, and recommendations.
Download the Full report

Theme 1

Nonprofit Capacity is Under Compounding Pressure

Organizational capacity is being squeezed from multiple directions at once.

Arrow SOCB
67%

Rising Demand

Demand for services is rising – 26% report a substantial jump.

Group 41154
89%

Funding Shortfalls

Half face significant funding gaps or regularly struggle to meet needs.

Money
59%

Rising Operating Costs

Rising costs are limiting their ability to invest in capacity.

Group 41155 (1)
74%

Increased Volatility

Shifting funding and political landscapes are making planning harder.

Capacity pressure shows up across every organizational function, and most needs are intensifying

How common each capacity need is, and whether it's becoming more urgent

Note: Analytic sample includes nonprofits and intermediaries (n = 498). Quadrant lines indicate median values.

Theme 2

Recognition is Not Consistently Translating into Support

By Every Measure, Dedicated Capacity-Building Funding is Scarce

What funders earmark

45%

Median share of grantmaking designated for capacity building among the 45% of funders who fund it

Even among funders that invest in capacity building, relatively little of their grantmaking is designated for it. 

Our [main grants are] tied to impact in four key pillars…organizations must have programs that serve [those].

— Funder focus group participant


Source: Catalyst Exchange, State of Capacity Building Survey, 2026

Theme 3

Fit and context matter for results

The majority of nonprofits seek systematic help navigating to the right supports

Nonprofits seek systematic help navigating to the right supports

Note: Analysis includes 474 nonprofits (direct-service nonprofits and intermediaries). Respondents could select more than one response.
Source: Catalyst Exchange, State of Capacity Building Survey, 2026

“Readiness” is associated with stronger capacity-building effectiveness

“Readiness” is associated with stronger capacity-building effectiveness

Clarity on what they need

Organizational stability

Internal capacity and time

Leadership continuity

Theme 4

Barriers to building capacity make existing disadvantages worse

For smaller nonprofits, disadvantage compounds at every step

Budgets under $1M Budgets of $1M or more
  1. Can’t invest

    Regularly struggle to meet funding needs

    25%

    vs 6%

  2. Can’t navigate

    Don’t know where to start

    34%

    vs 16%

  3. So they do less

    Less than 1% invested in capacity building

    26%

    vs 16%

  4. And get less

    See no improvement from capacity building

    27%

    vs 14%

  5. Funders back them less

    Have private foundation grants

    63%

    vs 88%

…which leaves even less slack to invest

Note: The nonprofit analytic sample is n = 467. Percentages may not sum to 100% due to rounding or because respondents could select more than one response.
Source: Catalyst Exchange, State of Capacity Building Survey, 2026

Gear

What It Would Take to Close the Gap

1

Treat organizational capacity as core to mission and impact.

2

Set up capacity building for success.

3

Leverage capacity investments to unlock organizational potential.

4

Support continuous improvement across the capacity-building ecosystem.

Download the report to explore the complete set of findings and detailed recommendations for funders and nonprofits

Your Turn

Join the Conversation

Of the four places the report points to, tell us which one deserves attention first.

Pick your priority:
Report

State of Capacity Building Report

Download our report

The State of Capacity Building Study was made possible with support from Blue Meridian Partners. We are grateful for their investment in strengthening the field's understanding of organizational capacity and capacity building.